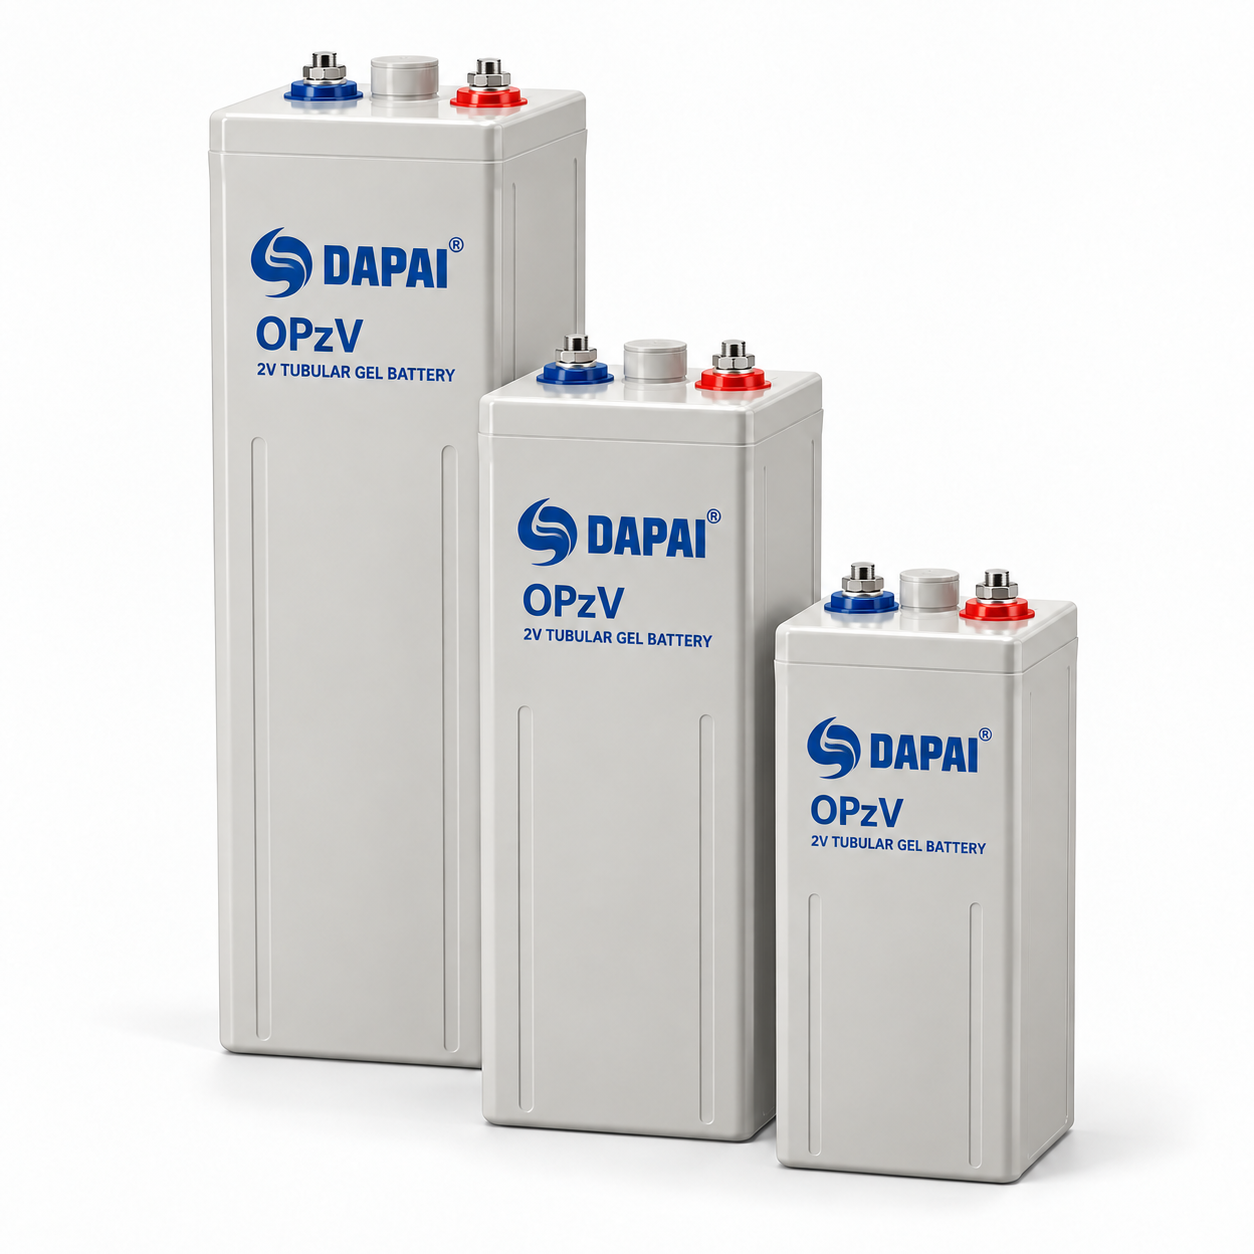
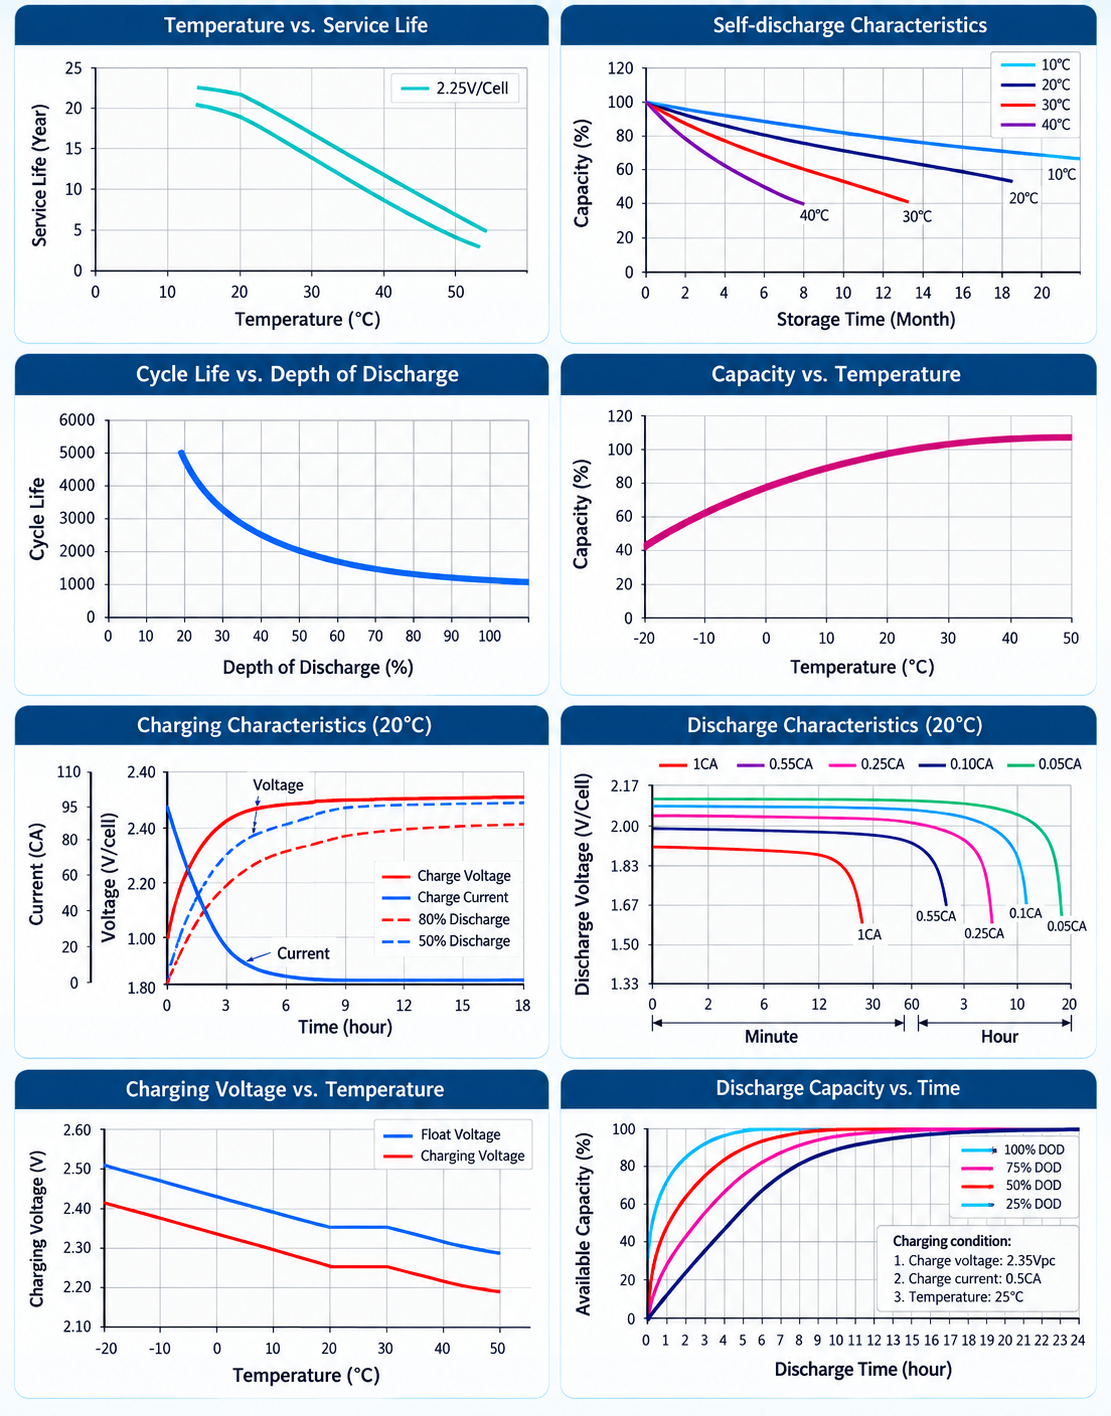
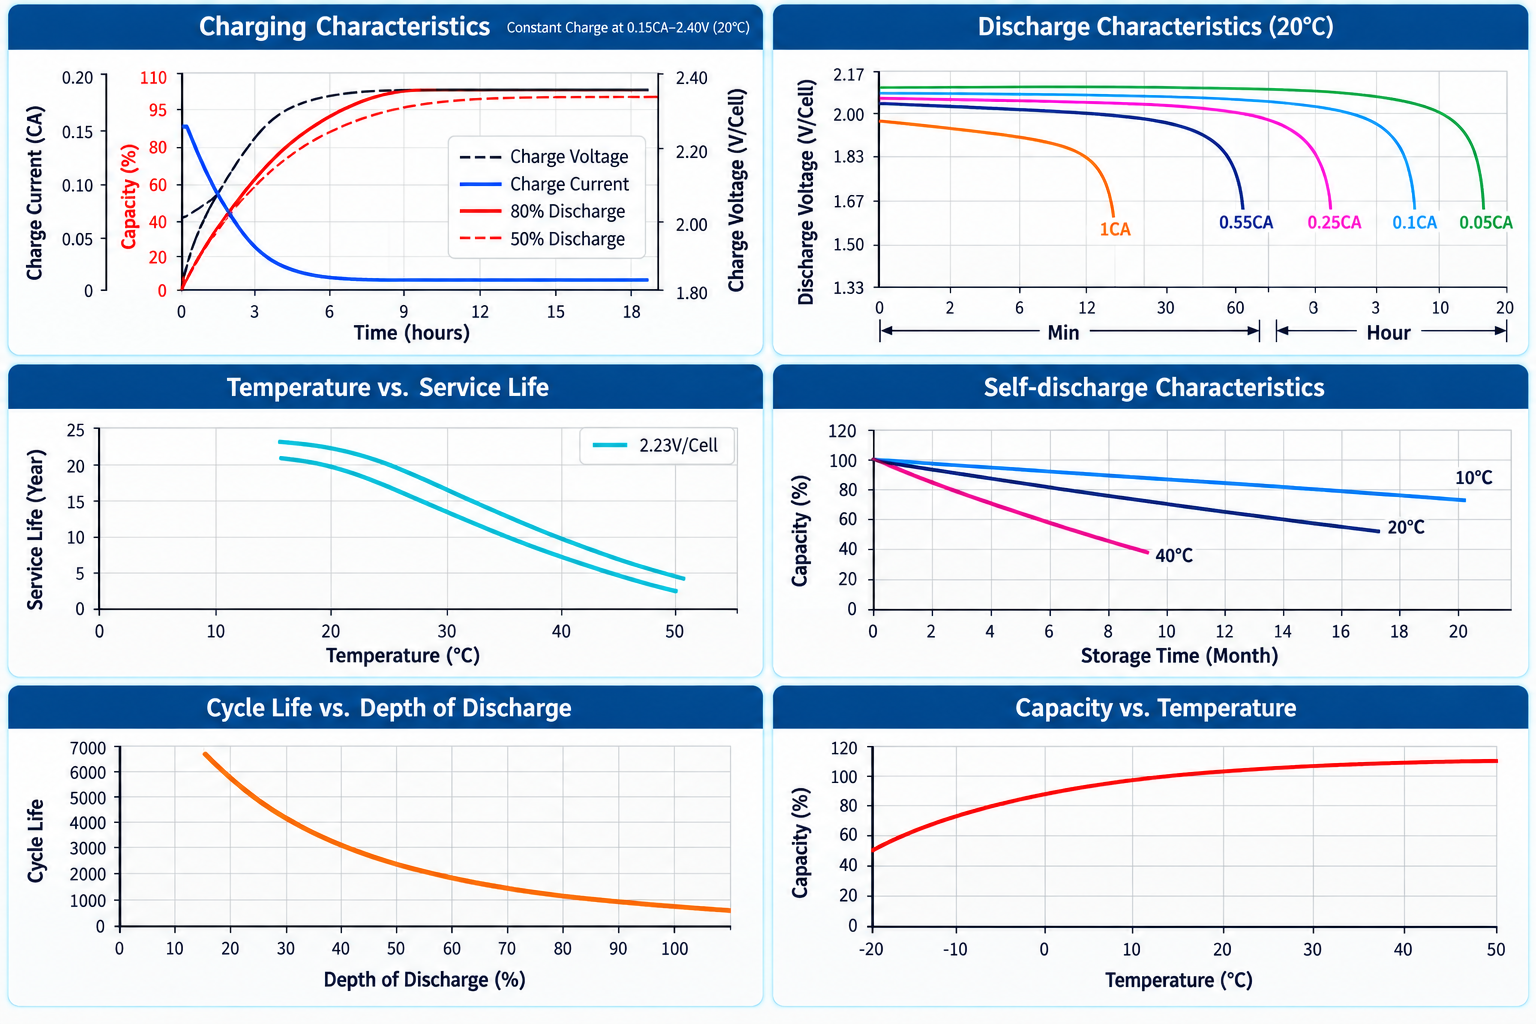
Manufacturer reference curves for OPzV tubular gel cells. At 20°C, the supplied chart shows cell voltage over time at discharge rates of 1CA, 0.5CA, 0.25CA, 0.1CA and 0.05CA. Other charts cover float life by temperature, self-discharge, cycle life by depth of discharge, capacity by temperature, charging performance and charge voltage by temperature. Actual results vary by model and operating conditions.